
Evaluate. Compare. Decide.
Cell Tower Lease Valuation Guide
A clear breakdown of how cell tower leases are valued - and what drives pricing.
Telecom Lease Valuation: How to Calculate Your Buyout Value
Understand the math, the risks, the investor models, and the factors that drive your lease’s true market value.
Cell tower lease value is determined by risk, escalators, lease term, tenant type, and investor IRR targets — not a simple “multiple.”
Typical Valuation Range
Most leases fall between 15×–20× annual rent
Premium, hard-to-replace sites can reach 17×–25×
Adding the underlying steel/tower structure (if you own it) can increase value by 5× - 10×, depending on location and tenant mix
High-risk sites - or locations without a Tier-1 carrier (AT&T, Verizon, T-Mobile) - often fall in the 3×–10× range
Vacant towers (“cold steel”) typically have little to no buyer interest unless located in a uniquely strategic area
What Drives Your Value Up or Down
Higher escalators → higher valuation
A longer control period (more years being acquired) → higher valuation
Tier-1 tenants (AT&T, Verizon, T-Mobile) → lower risk → higher valuation
Zoning barriers or site scarcity → premium pricing
Not able to grant an easement (assignment-only structure) → discounted value
What This Analysis Helps You Do
Understand how buyers actually calculate value
See how IRR, cap rates, and risk shape pricing
Review real valuation scenarios
Use AI valuation prompts to estimate ranges
Need the basics first? Read: The Cell Tower Lease Buyout Guide →
Overview
Most property owners never see how buyers actually underwrite a cell tower lease — and as a result, the valuation process feels confusing, inconsistent, or “behind closed doors.” The truth is that every buyout offer is driven by a specific financial model, a target return, and a risk profile that changes based on the tenant, escalators, market conditions, and the strength of your lease.
This guide breaks down that valuation process in clear, simple terms. You’ll see how investors calculate your buyout value, why different sites command different multiples, and which factors have the greatest impact on price. Whether you're comparing offers or trying to estimate your lease’s worth, this section gives you the framework buyers are using behind the scenes.
Our goal is to help you understand the math, the risk adjustments, and the strategic value of your location — so you can make a confident, informed financial decision.
How Valuation Actually Works (Multiples vs. IRR)
Most property owners are told their lease is worth “18×” or “20× annual rent.” Multiples are simple, familiar, and easy to communicate — but they are not how buyers actually calculate value. Behind every offer is a financial model based on IRR (internal rate of return), risk adjustments, and long-term income assumptions. The “multiple” is just the surface-level number that comes out of that model.
Multiples: Easy to Understand, Hard to Trust
A multiple tells you how many years of future rent a buyer is willing to pay today.
But multiples are inconsistent because they don’t reflect:
lease risk (termination, assignment, relocation)
tenant strength
escalation timing
remaining lease term
market density
buyer type
Two sites that both rent for $2,000/month might appraise at 12×, 18×, or 25× depending on these inputs. This is why comparing “multiples” between owners often leads to confusion.
IRR: What Buyers Actually Use
Investors don’t start with a multiple — they start with an IRR target.
IRR represents the return the buyer needs to earn on their investment, after factoring in:
the monthly rent streams
rent escalators
renewal assumptions
expected site lifespan
risk of termination or consolidation
market stability
cost of capital
Once the buyer inputs your lease into the model and applies their IRR target, the resulting valuation is converted into a multiple for presentation.
This is why two offers with the “same multiple” can be built on completely different financial assumptions.
Why IRR Produces More Accurate Pricing
IRR modeling provides a clearer picture of:
how long the income will realistically last
how valuable your escalators are over time
how risky your lease is compared to others
what the site contributes strategically to a network or portfolio
A lower IRR target (meaning the buyer views your site as safer and more stable) produces a higher buyout value.
A higher IRR target (more risk or uncertainty) produces a lower buyout value.
IRR = Internal Rate of Return
The Multiple Is the Output — Not the Method
Think of it this way:
Multiple = IRR model output
not
IRR = Multiple model
This small shift in understanding explains why:
One owner receives 24×
Another receives 15×
Another receives 10×
And someone else receives no offer at all
They’re not being treated unfairly — their leases simply sit in very different positions on the IRR risk/return curve.
Multiple = Output
IRR = Method
The Core Building Blocks of Valuation
1. Rent & Escalators
The starting point of any valuation is the rent amount and how quickly it grows.
Buyers look at:
Your current monthly rent
Your escalation rate (2%, 3%, fixed-term bumps, CPI, none)
When escalators occur in the rent stream
Whether escalators keep up with inflation
How escalators compare to market norms
Why it matters
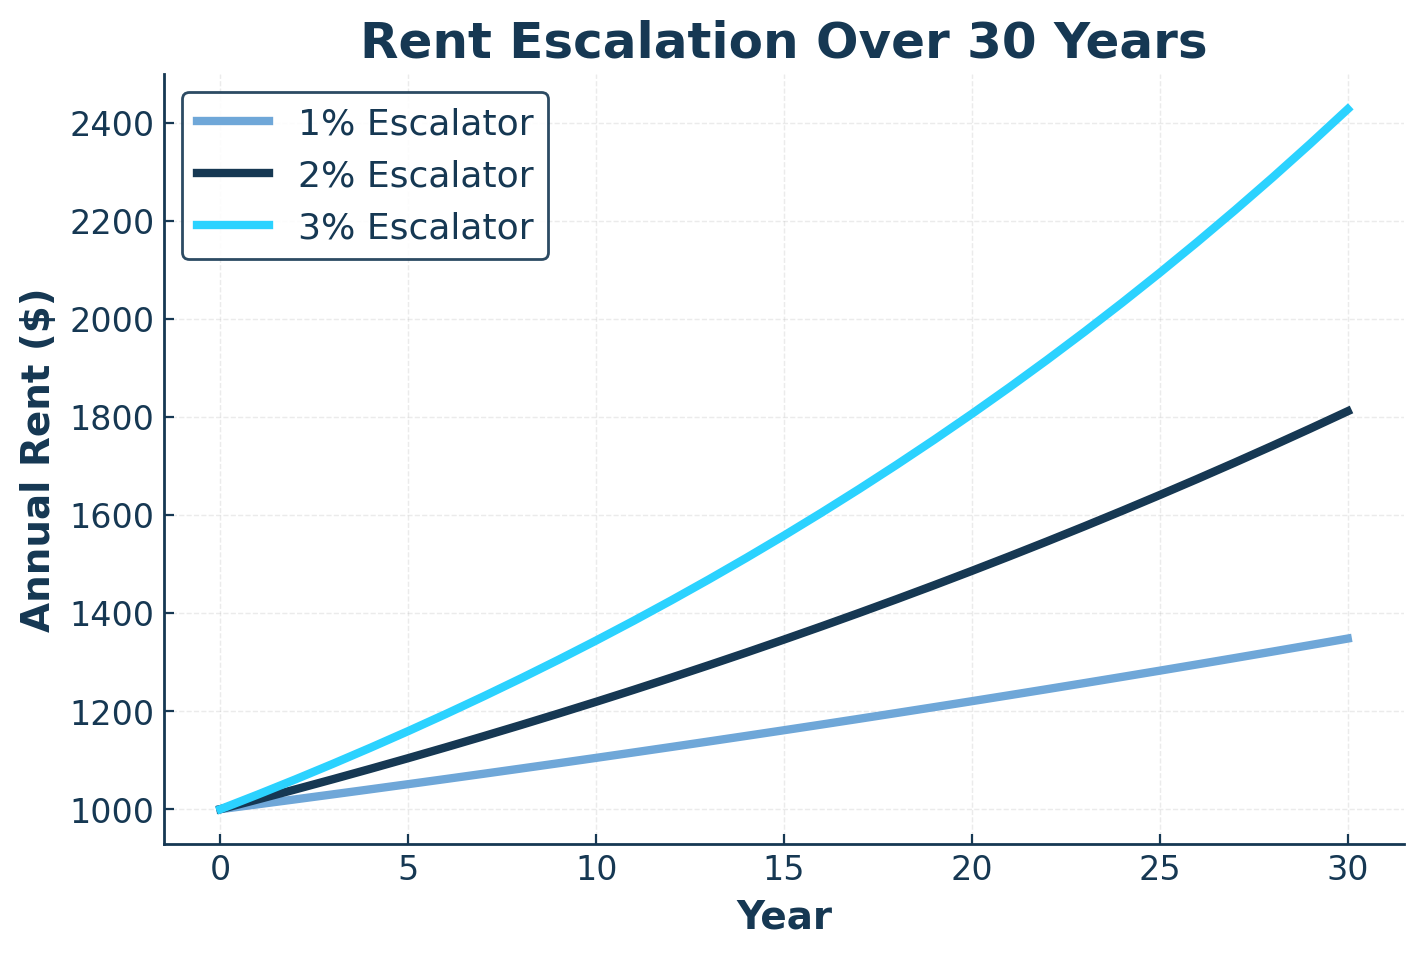
Escalators impact valuation more than most owners realize.
A 3% annual escalator compounds significantly over a 30–99 year easement, often adding hundreds of thousands of dollars to long-term income. A 0% or 1% escalator, on the other hand, lowers future cash flow—and therefore lowers valuation.
Remaining Lease Term & the Control Period
Why this matters more than most owners realize
When investors evaluate a cell tower lease, they are not simply pricing the rent — they are underwriting property control, legal stability, and the ability to secure long-term rights. These factors directly affect the buyer’s risk, IRR targets, and ultimately the valuation multiple they are willing to offer.
Even strong rent terms or escalators cannot overcome issues related to unclear ownership, short underlying leases, or restrictive property rights. Conversely, when long-term control is secure and the property structure is clean, buyers assign lower risk and significantly higher valuations.
These factors determine whether a buyer views your lease as low-risk or high-risk — which directly drives the valuation multiple they can offer.
Buyers focus most on the following areas:
1. Ownership & Property Control Factors
These elements determine whether a buyer can confidently acquire and operate the lease over decades.
Split ownership, ground leases nearing expiration, active mortgages requiring SNDAs, or unclear responsibility for tower maintenance all introduce structural risk.
The more uncertainty in these areas, the higher the buyer’s IRR target — and the lower the valuation.
2. Ability to secure long-term control
This is the single biggest driver of cell tower lease valuation and one of the most overlooked by property owners.
Buyers pay premium pricing when they can convert your lease into a:
30-year easement, or
perpetual / 99-year control agreement
Long-term control significantly reduces renewal and termination risk.
It also determines whether future co-locations (additional carriers or equipment) are even possible.
Most major carriers require 20+ years of remaining or secured term at the time of interest before approving a new colocation.
Without sufficient term, the buyer cannot capture future upside — which directly suppresses valuation.
More control = lower risk → lower IRR → higher valuation.
Limited control = higher risk → higher IRR → lower valuation.
3. Lease Language (Critical Clauses)
Right of First Refusal (ROFR)
ROFR clauses can complicate or delay buyouts; overly broad ROFR rights often reduce buyer participation and lower valuation.
Consent for Assignment
Some leases require landlord approval before the tenant can assign its rights. Similar to ROFR, restrictive assignment language can discourage buyers and limit competitive offers.
Consent for Modifications
Clear upgrade language reduces operational uncertainty. Overly restrictive or unclear modification terms increase the perceived risk of maintaining a long-term tenant, which can reduce valuation.
Leased Premises Size (square footage)
Buyers evaluate whether the existing footprint provides sufficient space for upgrades and potential co-locations. More clearly defined space = more upside potential, while limited or ambiguous space reduces future flexibility and valuation.
Option to Expand Premises
If the tenant or buyer has the right to expand equipment space or add structural elements under the lease or purchase terms, it creates future upgrade capacity, which can increase both long-term value and the offer amount.
Revenue share if additional tenants are added
Revenue-sharing clauses add upside for future co-locations, which increases long-term projected income and raises valuation.
What This Means for Your Valuation
Buyers don’t just underwrite the rent — they underwrite the structure behind the lease. The cleaner the ownership, the stronger the property control, and the more secure the long-term rights, the lower the buyer’s risk and the higher the valuation multiple they’re willing to offer.
If any part of the ownership structure, ground lease timing, mortgage status, tower responsibility, or lease language introduces uncertainty, buyers increase their IRR target — which directly reduces your buyout value.
Control drives valuation: more control = lower risk → lower IRR → higher buyout value.
Tenant Type (Carrier Tier)
Not all tenants carry the same risk profile — and buyers price risk aggressively. Your tenant (AT&T, Verizon, T-Mobile, Dish, regional carriers, WISPs, government, private enterprise, etc.) plays a major role in determining valuation multiples and buyer interest.
Why Tenant Type Matters
Buyers evaluate both credit strength and network stability. A financially strong carrier with long-term network plans reduces risk, lowers the buyer’s IRR target, and increases the valuation. A weaker or less established tenant increases uncertainty — and reduces valuation.

Tier 1 Carriers (National)
AT&T, Verizon, T-Mobile
Premium stability & strongest valuations.

Emerging & Secondary
Dish, US Cellular, regional carriers
Moderate stability; mid-range valuations.

Local Providers
WISPs, ISPs, broadband operators
Higher risk → low valuations.

Government & Utility
Municipal, public safety, utility networks
Stable but limited upside; mixed valuations.
Why Tenant Type Influences Valuation
Tenant type directly impacts a buyer’s perception of risk. Strong, established carriers reduce the likelihood of termination, increase renewal probability, and create more predictable long-term income. Weaker or less-established tenants introduce uncertainty, which increases the buyer’s IRR target — and lowers the valuation multiple they can offer.
Multi-tenant sites are especially valuable. Locations with two or more carriers deliver higher income stability, reduced termination risk, and significantly stronger buyer demand. Towers with a mix of Tier 1 carriers often receive meaningful valuation premiums because future cash flow is more secure.
Stable tenant + low risk → lower IRR → higher valuation
Uncertain tenant + higher risk → higher IRR → lower valuation

Market Density & Location Economics
Even with strong rent, long control periods, and Tier-1 tenants, the value of a telecom lease is shaped heavily by where the site sits within the carrier’s network. Market density — how many towers, rooftops, and small cells surround your property - directly influences buyer demand, perceived risk, and ultimately the IRR target an investor applies.
This section explains how location-specific network economics impact valuation, why two nearly identical leases can trade at dramatically different multiples, and how buyers evaluate the strategic importance of your parcel beyond the rent amount.
Why Market Density Influences Valuation
Buyers and carriers evaluate your location through a network-planning lens, not a real estate lens. They consider:
Competition from nearby structures → More alternatives = higher termination risk
Carrier network congestion → High-traffic areas have more strategic value
Zoning barriers or siting restrictions → Hard-to-build areas command valuation premiums
Geographic terrain (coastal slopes, hills, valleys) → Impacts signal propagation and site necessity
Urban vs. suburban vs. rural differences → Each environment has different redundancy patterns and revenue potential
These factors shape a buyer’s confidence in the site’s longevity, which is one of the strongest drivers of valuation multiples.
How Buyers Analyze Market Density
Investors use a mix of public data, RF engineering tools, and proprietary mapping to determine whether your location is:


“Anchor Site” (Premium Value)
Hard-to-replace, zoning-restricted, topographically advantageous.
Effects: Lower IRR → higher valuation.
“Redundant Site” (Mid-Range Value)
Useful but with multiple nearby alternatives.
Effects: Moderate IRR → moderate valuation.
“Replaceable Site” (Discounted Value)
Flat geography, permissive zoning, multiple existing structures close by.
Effects: Higher IRR → lower valuation.
This explains why one property may receive a 20× multiple while another receives 12× — even when rent and escalators are identical.
Location plays a major role in valuation because it influences how difficult—or how easy—it is for a carrier to replace your site

Location Characteristics That Increase Valuation
A property becomes strategically valuable when it offers:
Unique elevation or coverage advantage
Strict zoning barriers (moratoriums, height limits, or strong community opposition)
High-demand network traffic with few viable alternatives
Municipal or public-safety reliance on the structure
Dense urban clusters where rooftop or tower replacements are difficult to build
These characteristics reduce long-term uncertainty for the buyer—lowering their IRR target and pushing valuation upward.

Location Characteristics That Decrease Valuation
A property is typically discounted when it sits in:
Flat, open areas with many easy replacement options
Markets saturated with existing towers and rooftops
Permissive zoning, allowing fast, inexpensive new builds
Declining population or reduced carrier network investment
Nearby tenant-built redundancy
Greater replaceability increases perceived risk—raising the buyer’s IRR requirement and reducing valuation.
What This Means for Your Buyout Value
Market density often explains the valuation gap between:
Owners who receive no offer at all,
Those offered 10×–14×, and
Those receiving 20×+ multiples.
Even strong leases will price lower in replaceable markets, while modest leases can price exceptionally high in constrained or strategic locations.
This section helps owners understand the “why” behind their offer — and prepares them for the sample valuation scenarios further down in the guide.
Cap Rates & How Investors Use Them (and Why They Matter in Telecom Valuation)
Most property owners hear the term cap rate from commercial real estate — and assume cell tower buyouts work the same way. They don’t. While cap rates can be used to compare valuation ranges, telecom buyers rely far more on IRR modeling, risk adjustments, and network economics than on traditional real-estate underwriting.
This section breaks down what a cap rate is, how it applies (and doesn’t apply) to telecom leases, and how cap rate benchmarks help explain why seemingly similar leases trade at very different prices.
What a Cap Rate Actually Represents
A capitalization rate is a simple formula:
Cap Rate = Annual Rent ÷ Purchase Price
Cap rates provide a quick way to compare the “yield” of different investments.
A lower cap rate = a higher purchase price relative to income.
A higher cap rate = a lower price relative to income.
But in telecom, cap rates are outputs, not decision drivers. Investors don’t start with a cap rate — they start with:
IRR targets
Rent escalators
Lease term & control
Tenant credit
Site risk factors
Replacement difficulty / market density
Once the model is complete, the cap rate naturally appears as a result, not as the starting point.
Why Cap Rates Are Misleading in Telecom
Traditional real estate uses cap rates because buildings have:
Predictable long-term occupancy
Market comps
Broad liquidity
Telecom leases do not behave like typical real estate assets. They have:
Single tenants (AT&T, Verizon, T-Mobile, Dish, or WISPs)
Binary renewal / termination outcomes
No true market comps
Risk concentrated in a single revenue stream
Value driven by network necessity, not foot traffic or tenant mix
Because of these factors, cap rates in telecom vary wildly even for the same rent amount.
A site might sell at:
4% cap if low-risk (Tier 1 carrier, long control, high barriers to replacement)
6–7% cap if medium risk
10%+ cap if high risk (local WISP, expiring term, easy replacement, weak assignment rights)
The cap rate is simply the mathematical reflection of the buyer’s underlying risk model and IRR assumptions.
How Investors Actually Use Cap Rates
Buyers use cap rates in three key ways:
1. To Check Whether a Valuation Fits Market Norms
After running the IRR model, investors back into an implied cap rate.
If the resulting number is far outside the typical range for the risk level, they’ll adjust up or down.
Example:
If a high-risk site models out to a 4% cap, the buyer knows the offer is mispriced — because no one pays that low a yield for a high-risk lease.
2. To Compare Deals Within Their Portfolio
Cap rates help investors compare leases with different rents, escalators, and tenants.
This lets them quantify:
Which deals require higher returns
Which are “core” low-risk assets
Where future acquisitions should be priced
3. To Translate IRR Assumptions into a Simple Metric for Sellers
Cap rates are used for communication — not underwriting.
They help property owners understand why one lease commands a 22× multiple while another commands 12×.
Cap rate ↓ → multiple ↑ → valuation ↑
Cap rate ↑ → multiple ↓ → valuation ↓
Typical Cap Rate Ranges in Telecom (by Risk Category)
These ranges reflect common industry pricing patterns:
Low-Risk Assets (Premium Sites)
Tier 1 carriers
Long control period (20+ years or easement)
Hard-to-replace markets
Typical Cap Rate: 4.0% – 5.5%
Moderate-Risk Assets
Secondary carriers (Dish, US Cellular)
Some market redundancy
Mixed lease language
Typical Cap Rate: 6.0% – 8.0%
High-Risk Assets
WISPs, local ISPs, government/non-carrier tenants
Short remaining term
Easy replacement environment
Typical Cap Rate: 9.0% – 12%+
These are not rules — they’re patterns informed by risk, network stability, and investor IRR targets.
Cap Rates vs. Multiples: How They Connect
Cap rates and multiples communicate the same idea in different forms.
Multiple = Years of rent being paid upfront
Cap rate = Required yield on investment
They’re inversely related:
Multiple ≈ 1 ÷ Cap Rate
Examples:
5% cap → ~20× multiple
6% cap → ~16.7× multiple
8% cap → ~12.5× multiple
10% cap → ~10× multiple
This simple conversion lets owners understand why a buyer offering a 24× multiple sees a site as extremely low-risk, while a 10× multiple signals significant perceived risk.
What This Means for Your Lease Valuation
Cap rates provide useful insight into:
How buyers view the risk of your lease
Whether your offer is competitive for current market conditions
Why higher-risk leases must trade at higher cap rates
How small changes in risk (assignment language, remaining term, tenant quality) can swing valuation dramatically
Cap rates don’t tell the whole story — but they help you understand the story the buyer is reading.
This section sets the stage for the Sample Valuation Scenarios that follow, where you’ll see exactly how IRR, escalators, tenant type, and market density translate into real-world valuation differences.
Sample Valuation Scenarios (How Small Differences Create Big Valuation Gaps)
Two cell tower leases can have the same rent and still appraise 10× apart — because buyers price risk, control, tenant quality, and long-term predictability very differently.
Below are real-world style scenarios that show how investors move from IRR modeling → cap rates → valuation multiples → buyout offers.
These aren’t formulas for your exact site — but they demonstrate the logic behind how buyers arrive at dramatically different numbers.
Scenario 1 — Low-Risk, Premium Valuation (Tier 1 Carrier + Strong Control)
Profile:
Tenant: AT&T
Rent: $2,000/month
Escalator: 3% annual
Remaining Term: 22 years (assignment/easement allowed)
Market: Dense, hard-to-replace suburban zone
Owner Control: Clean, no restrictions or ambiguities
Buyer View: Long-term, stable, low-risk income
Investor Model Output:
Target IRR: 4.5% – 5.0%
Implied Cap Rate: ≈ 4.8%
Implied Multiple: ≈ 20×–22×
Approx. Valuation: $480,000 – $528,000
Why It Prices High:
The buyer sees very little termination risk, excellent escalation value, and strong network necessity. A Tier 1 tenant + long-term control forces the buyer to lower their IRR → valuation rises.
Scenario 2 — Moderate-Risk, Middle-Market Valuation (Secondary Carrier + Mixed Controls)
Profile:
Tenant: Dish
Rent: $2,000/month
Escalator: 2% annual
Remaining Term: 12 years
Market: Replaceable, multiple nearby alternatives
Lease Language: Standard, but assignment requires landlord approval
Buyer View: Moderate uncertainty + mid-range stability
Investor Model Output:
Target IRR: 6.5% – 7.5%
Implied Cap Rate: ≈ 6.8%
Implied Multiple: ≈ 14×–15×
Approx. Valuation: $336,000 – $360,000
Why It Prices Mid-Range:
Dish is less stable than the Tier 1s, assignment restrictions add perceived friction, and the market redundancy increases risk. The buyer needs a higher IRR → valuation decreases.
Scenario 3 — High-Risk, Lower Valuation (WISP or Local Provider)
Profile:
Tenant: Local WISP
Rent: $2,000/month
Escalator: 0% (no increases)
Remaining Term: 7 years
Market: Highly replaceable; towers and rooftop alternatives nearby
Lease Language: Ambiguous modification terms, small footprint
Buyer View: High churn risk + no escalator + limited long-term control
Investor Model Output:
Target IRR: 10% – 12%
Implied Cap Rate: ≈ 9–10%
Implied Multiple: ≈ 10×–11×
Approx. Valuation: $240,000 – $264,000
Why It Prices Low:
Small operators fail often, lack credit strength, and don’t commit to long-term network plans. No escalator + short remaining term forces buyers to demand a much higher IRR → sharply reduced valuation.
Scenario 4 — Premium Site with Structural Ownership (Tower Steel Included)
Profile:
Tenant: Verizon
Rent: $2,000/month
Escalator: 3% annual
Remaining Term: 18 years
Owner: Also owns the tower steel (not just ground rights)
Market: Strong; co-location potential for additional tenants
Buyer View: Unique, high-value asset with future upside
Investor Model Output:
Target IRR: 4.25% – 4.75%
Implied Cap Rate: ≈ 4.5%
Implied Multiple: ≈ 22×–24×
Approx. Valuation: $528,000 – $576,000
Why It Prices Highest:
Owning the tower structure allows future tenants → major upside. Buyers lower their IRR to compete for these rare sites, pushing multiples far above standard ground leases.
Scenario 5 — “No Offer” Outcome (Why Some Sites Attract Zero Buyer Demand)
Profile:
Tenant: AT&T (Tier 1 — but…)
Remaining Term: Only 3 years
No easement allowed
Escalator: 0%
Market: Carrier already built a replacement site nearby
Lease Language: ROFR + restrictive assignment
Buyer View: Too much uncertainty; minimal long-term income
Investor Model Output:
IRR target cannot be met at any reasonable price
Implied valuation would produce a 30%+ IRR, which is unmarketable
Result: Buyers pass — no meaningful offer
Why Buyers Walk Away:
Even with a Tier 1 tenant, renewal probability appears extremely low. Without long-term control, the investor cannot secure future cash flow → the lease has “speculative” value only.
What These Scenarios Teach You
Across all examples, you’ll notice the pattern:
Small changes in risk → big changes in IRR → big swings in valuation.
+3% escalator vs. 0%
20 years of control vs. 7
AT&T vs. a small WISP
Scarce market vs. replaceable market
Clean assignment rights vs. restrictive language
These factors can move valuation by 50–150% even when the rent is identical.
This is why multiples alone are unreliable — and why understanding investor IRR modeling is the key to understanding your buyout value.
Want an Estimate for Your Lease?
Use these AI-Powered Valuation Prompts**
The next section will show owners how to use ChatGPT Valuation Prompts to generate a preliminary valuation range — and how Phone Booth Capital can refine it with real underwriting.
AI Valuation Prompts
AI tools like ChatGPT can help property owners generate preliminary valuation ranges based on the same factors professional buyers analyze: rent, escalators, tenant type, risk profile, market density, remaining term, and long-term control.
These prompts do not replace underwriting, but they can help you understand how different variables affect your buyout value — and they’re one of the fastest ways to get an initial estimate before speaking with a valuation expert.
Below is a library of pre-built prompts you can copy/paste directly into ChatGPT.
How to Use These Prompts
Copy a prompt below
Paste it into ChatGPT
Add your lease details when asked
Review the AI’s valuation range
Send the result to Phone Booth Capital for a professional review
AI helps you understand the math. PBC helps you understand the risk, the market, and the true buyer demand.
Prompt #1 — Quick Value Estimate Using Rent & Basic Risk Factors
Copy/paste this into ChatGPT:
Estimate the valuation range for a cell tower lease buyout based on the following details.
Provide:
• A valuation multiple range
• An estimated purchase price
• A risk explanation
• The IRR assumptions a buyer would likely use
• A comparison to typical market ranges (low-risk, mid-risk, high-risk)
Details:
- Monthly Rent: [enter amount]
- Rent Escalator: [enter %]
- Tenant: [AT&T / Verizon / T-Mobile / Dish / WISP / other]
- Lease End Date: [enter year]
- Assignment/Easement Allowed: [yes/no]
- Market Type: [urban / suburban / rural]
- Any known nearby towers or rooftop sites: [describe]
Prompt #2 — Full IRR-Based Valuation Model (More Detailed Output)
Create a detailed IRR-based valuation analysis for my cell tower lease using the inputs below.
Include:
• The IRR a buyer would likely target and why
• A modeled valuation range based on those IRR levels
• Implied cap rate and price multiple
• Buyer’s risk assessment for each variable
• How much each factor (tenant, escalator, control, market density) influences valuation
• A comparison against real-world scenarios
Inputs:
- Monthly Rent: [enter]
- Annual Escalator: [enter]
- Tenant Type and Stability: [enter]
- Remaining Lease Term: [enter]
- Ability to grant easement: [yes/no]
- Zoning difficulty or barriers to replacement: [describe]
- Market density / nearby competing sites: [describe]
Prompt #3 — “What If” Analysis (See How One Change Impacts Value)
Use this to show how escalators, tenant upgrades, or term extensions change your valuation.
Run a “what-if” valuation analysis for my cell tower lease.
Show how the valuation changes under these variables:
1. Escalator increases by 1%, 2%, or 3%
2. Remaining lease term increases by 5, 10, or 20 years
3. Tenant changes from [current tenant] to a Tier-1 carrier
4. Market scarcity improves or worsens
5. Easement is granted versus not granted
Provide:
• New valuation multiples for each scenario
• New estimated purchase prices
• How each variable affects IRR and buyer risk
Prompt #4 — Compare Multiple Offers (Huge for Lead Conversion)
Great for owners who already have offers but don’t understand the differences.
Help me compare multiple cell tower buyout offers.
Explain:
• Why each buyer is pricing differently
• The implied multiple and cap rate for each offer
• Whether the offers reflect low, medium, or high risk
• What hidden risks buyers might see in my lease
• What changes could increase the valuation
Offers:
- Offer #1: [enter $ amount, escalator, terms]
- Offer #2: [enter details]
- Offer #3: [enter details]
Lease details:
[enter summary]
Prompt #5 — AI-Powered Market Density Analysis
This helps owners understand how location affects valuation.
Analyze the market density and replacement risk for my tower or rooftop lease.
Provide:
• Whether the site is low-risk, moderate-risk, or high-risk from a network perspective
• How replaceability affects valuation multiples
• Whether buyers view the site as an “anchor site”
• How market density affects IRR and long-term pricing
Inputs:
- Property address or nearest intersection: [enter]
- Tenant: [enter]
- Known nearby towers, rooftops, or small cells: [enter]
- Zoning strictness or barriers to new towers: [describe]
Prompt #6 — AI Valuation Summary for Property Owners (Simple Language Version)
Perfect for owners who want a non-technical explanation.
Explain the valuation of my cell tower lease in simple, easy-to-understand terms.
Cover:
• What my estimated buyout value is
• Why the value isn’t just a multiple
• What risks my site has
• What strengths increase the valuation
• What buyers look for
Inputs:
[enter your lease details]
Prompt #7 — Red-Flag Analysis (Why Some Leases Get Discounted)
Review my lease and identify red flags that might reduce valuation.
Provide:
• Potential deal-killers
• Buyer concerns that increase their IRR target
• Specific sections of the lease that create risk
• The estimated value loss from each risk factor
Inputs:
[enter details]
Prompt #8 — AI-Generated Professional Valuation Report (Long-Form)
This creates a high-value deliverable (and a strong CTA for PBC to “double-check” the AI output).
Generate a detailed cell tower lease valuation report, including:
• Executive summary
• Valuation range with explanation
• IRR assumptions
• Cap rate and multiple conversion
• Scenario comparisons
• Risk analysis
• Tenant quality review
• Market density evaluation
• Long-term recommendations for the property owner
Inputs:
[enter lease details]
Why These Prompts Matter
AI gives property owners clarity and confidence — but only Phone Booth Capital can:
Validate the results
Identify hidden risks the AI can’t see in the lease document
Adjust valuation based on real buyer behavior
Provide real offers, not just estimates
This section positions AI as the front door and PBC as the trusted expert who gets the owner the best price.
Get a Professional Valuation for Your Lease
AI can estimate value - but a real buyer can confirm it.
This guide helps you understand how valuation works.
But every site is unique, and small details in your lease, assignment rights, zoning environment, or tenant history can move your valuation up or down by 20–50%.
Phone Booth Capital provides free, professional underwriting based on real investor models - not generic online calculators.
What You’ll Receive:
A customized valuation range using true buyer IRR models
A risk report showing what increases or decreases your value
A comparison to current market pricing and buyer demand
Recommendations to strengthen your position before negotiating
Why Owners Choose Phone Booth Capital
We specialize exclusively in lease valuations and buyouts
We model your lease the same way institutional buyers do
We help you understand the why behind your valuation
We ensure you get the strongest possible pricing

Drop your details below and we’ll review your lease, analyze the market, and provide a clear valuation report — usually within 24 hours.
Connect With Phone Booth Capital Today
Unlock the true value of your cell tower lease with expert guidance